This report presents updated national, regional and global estimates for water, sanitation, hygiene, environmental cleaning and waste management services in health care facilities from 2015 to 2025.
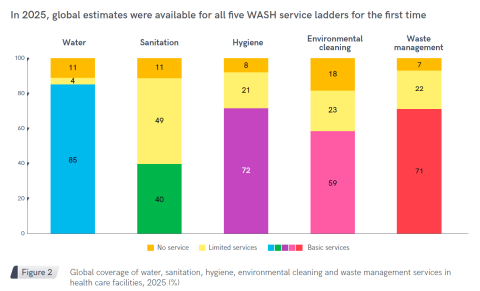
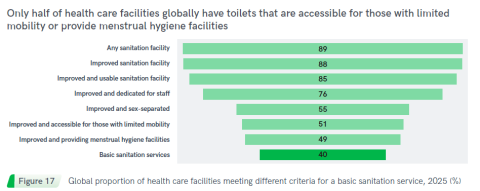
This report presents, for the first time, global estimates for all five basic service areas, including the first estimates for basic sanitation and environmental cleaning. In 2025, an estimated 85% of health care facilities had a basic water service, 72% had basic hygiene services and 71% had basic health care waste management services. However, only 59% met the basic standard for environmental cleaning and 40% met the requirements for a basic sanitation service.
Explore the data on the interactive portal, and download Excel files showing regional snapshots.
- WASH services in health care facilities, 2025
- Sanitation services in health care facilities, 2025
- Water services in health care facilities, 2025
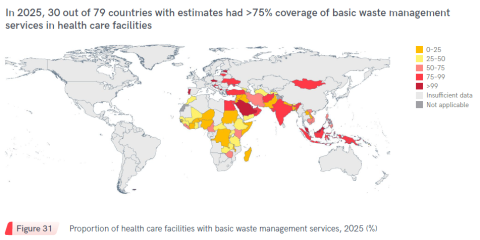
- Health care waste management in health care facilities, 2025
- Hand hygiene facilities at points of care
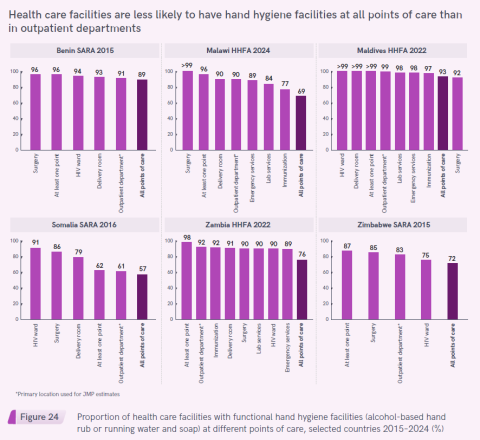
Different wards within health care facilities may have different access to hand hygiene facilities
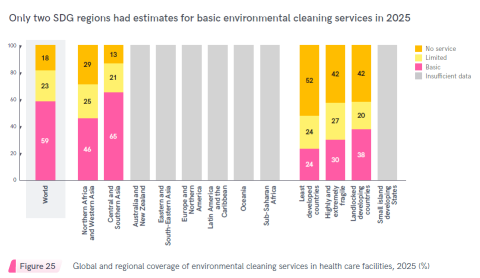
- Environmental cleaning services in health care facilities, 2025
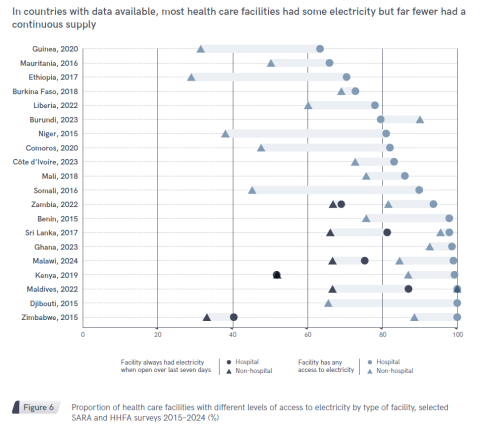
- Electricity in health care facilities
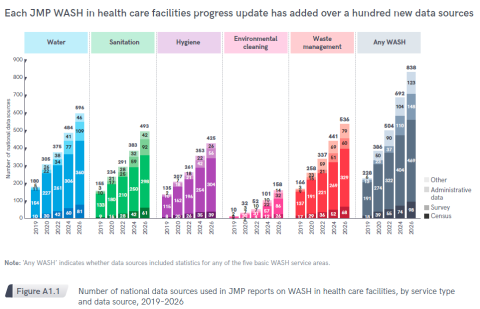
- The number of data sources available in JMP reports continues to grow
Scroll, swipe or use the arrow keys for more.